I have to admit. This section is personal to me. I taught middle-school Math and also substitute taught mathematics all across the city.

At some point, someone in every class asks “What do we need to know this for Mr. Gray?” Understanding something, and trying to explain it to others who don’t understand, has been the entire story of my life.
What I wanted for this section was a storyboard type of thing, using one of the Calamity Crew, Jermaine Jackson. He was to be a near future version of reality. He signed up to work for Federation Education organization.
He was tasked to explain straight lines and parabolas to the group or high school kids. They mock him, because he looks poor. He was in fact recently homeless.

One of the kids, is being drafted directly into the NBA. And there is a back and forth about worth.

The end of the scene, will JJ pointing at the kid, saying “You gonna be on that y=mx+b like a little bitch!”
Chat GPT literally just told me I should lower the amounts of people in the previous section to make the rewards seem more appealing. I told it, that it doesn’t see the full picture. Do you?
If you have a salary, your income line isn’t straight. Just from the planned inflation alone, no matter how much you make, you’re income will slowly curve parabolic to the downside.
For the average worker, income is not a straight line. Even if wages rise, inflation bends purchasing power downward year after year. What looks like progress in dollars becomes decline in real life.
The average person is taught to be proud of pennies growing in an investment app, while inflation quietly eats thousands from the value of their labor. Their line is not going up. It is curving down.
So let’s actually do the math. Not theory. Not opinion. Just the numbers.
Da Maff
A salary line by itself is often modeled as linear or slow exponential growth.
But once you divide by inflation, the worker’s real income becomes a downward-curving function if wages grow slower than prices.
1. Basic model
Let
- S0 = starting salary
- g = annual wage growth
- i = annual inflation
Then nominal salary after t years isS(t)=S0(1+g)t
Price level after t years isP(t)=(1+i)t
So real salary, measured in today’s dollars, isR(t)=P(t)S(t)=S0(1+i1+g)t
That is the real story.
If g<i, then real income shrinks every year.
2. Example: average worker
Suppose a worker starts at:
- salary = $50,000
- wage growth = 2% per year
- inflation = 3.5% per year
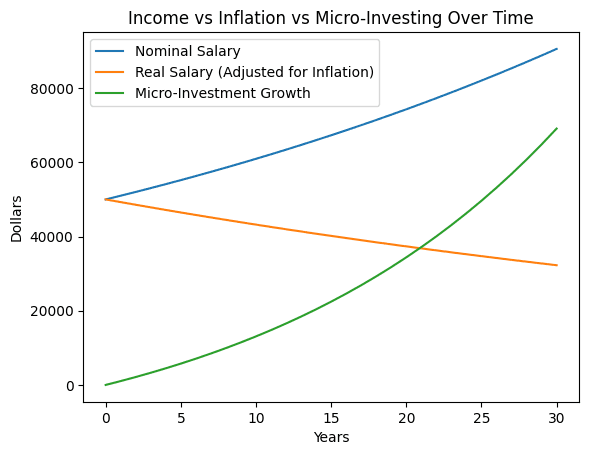
ThenR(t)=50000(1.0351.02)t R(t)=50000(0.9855)t
So in real terms, this worker loses about 1.45% of purchasing power per year.
Real salary over time
- Year 0: $50,000
- Year 5: about $46,490
- Year 10: about $43,230
- Year 20: about $37,350
- Year 30: about $32,270
So even though the worker may say, “I got raises,” their effective income is bending downward over time.
3. Why it feels parabolic
It feels parabolic because the loss compounds.
Early on, the damage seems small.
Later, the curve becomes obvious.
That is why people feel trapped. They are not just losing money once. They are losing future purchasing power on top of past losses.
4. Compare it to micro-investing
Now let’s compare that to a “responsible” micro-investment path.
Suppose the same worker invests:
- $20 per week
- that is $1,040 per year
- at 5% annual return
Future value after t years:FV(t)=1040⋅0.05(1.05)t−1
Investment value
- Year 5: about $5,746
- Year 10: about $13,080
- Year 20: about $34,390
- Year 30: about $69,120
That sounds nice until you compare it to the income erosion.
5. Same horizon comparison
From the salary example above:
Purchasing power lost from wage lag
Compared to staying at a true $50,000 real income:
- Year 5 loss: about $3,510 per year
- Year 10 loss: about $6,770 per year
- Year 20 loss: about $12,650 per year
- Year 30 loss: about $17,730 per year
That means by year 20, the worker is short $12,650 every year in purchasing power.
So the micro-investment account is trying to patch a hole in a sinking boat.
This is a graph they will never show you.
Being dramatic, funny, technical, or mathematical yields the same result. There is no way to survive on income in this world. You can hope things work out if you are a high earner. How many cautionary tales of former professional athletes being homeless do you know?
For most people, income alone isn’t enough to keep up with the system it exists inside. Everyone will always be ice-scating uphill. They taught us how to graph lines. They never told us we were the line.